I recently wrote about using TravisCI for continuously testing C++11 projects.
Now, what if a build fails?
Especially for C and C++ projects, build failures may mean crashed programs. In a local setup, the usual way to analyze program crashes is to manually inspect the core files that are written on crash.
With TravisCI, there is no way to log in to a build machine and inspect a core dump interactively. There is no SSH access to the build machines. TravisCI does not even persist any state of builds but the result and the log output.
There is a way to get to the core dumps, but it was fiddly to find out and set up.
The basic idea is to run gdb on the TravisCI build machine
automatically when a build fails. gdb can be scripted, so all
we need to do is to make it print a backtrace in all threads at
the time of the crash.
By default, no core dumps will be produced on TravisCI. To turn them
on, an appropriate ulimit value must be set. We also need to install
gdb so we can actually run it. Here is the .travis.yml adjustment
for these prerequisites:
1 2 3 4 5 | |
To get an idea of where the program crashed, we can finally install
an after_failure hook. This hook can check for a core file and use
gdb to print a nice backtrace.
The core file pattern on TravisCI seems to be core-%p, so core
filenames will include the executable’s process id and change on
every run. We can use find to look for files named core* in the
cwd and pick the first one as there should only be at most one core
file per build:
1 2 3 | |
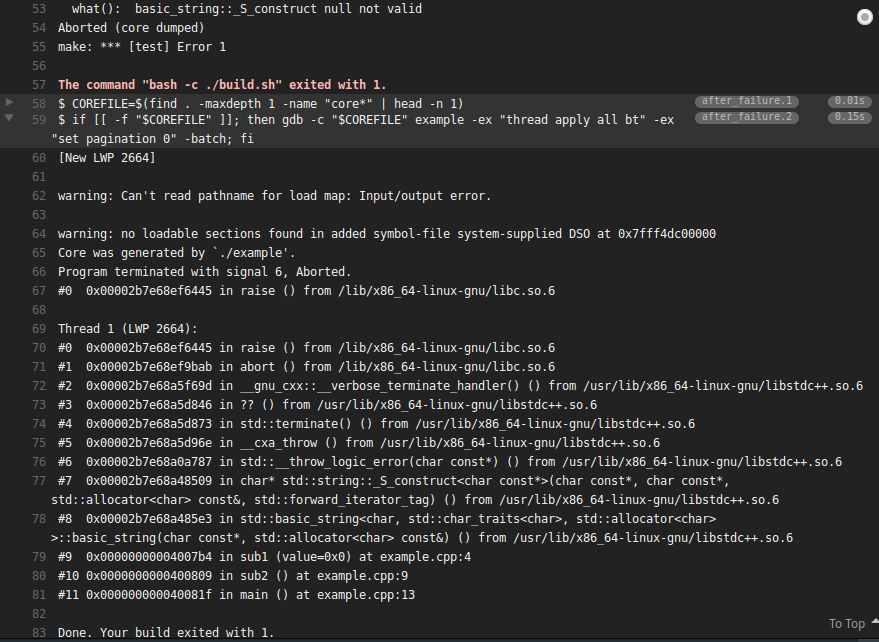
A failed build might produce output like this:
I recommend compiling the executable to test with debug symbols on and
with all optimizations turned off (i.e. compiler options -g -O0).
Otherwise backtraces might reveal less useful information for debugging.
On a side note: the Travis WebLint is a
handy tool for validating .travis.yml files before pushing them.